Day 6: MCNC customer satisfaction, net promoter score above industry standards
It’s that time of year again. No, not the holidays; well, yes, it’s the holidays. But, it’s also the time of year when many businesses seek to get a sense of how they’re doing or what’s going/gone well and what has not – e.g., their annual report card.
While many look at this time of year as a good opportunity to review people, processes and tools – internal element – those that often have the most success also use this time to look beyond their walls seeking feedback from those they serve.
Customer satisfaction surveys can be a key part of determining current and future strategies for nearly all strategic business units of an organization. A core element of our Excellent Service Delivery strategy is to send a client engagement survey annually to assess satisfaction and sentiment in a number of core areas including but not limited to the following:
- Service delivery
- Product/solution availability
- Trouble ticket resolution
- Communication and outreach efforts
MCNC’s customer satisfaction rate has never dipped below 96 percent - in fact, that last five years the overall customer satisfaction rate has been 98 or 99 percent. This truly remarkable statistic is the result of a lot of things, but largely a commitment to serve and meet the needs of our clients.
That sounds great, right? After all, who wouldn’t be satisfied 99 percent on a report card?
In 2022, we wanted to take our assessment one step further and dive deeper. We knew our clients were satisfied, but were they satisfied enough to recommend us to a colleague or a peer within or beyond their organization? Enter the Net Promoter Score (NPS), an indication of whether customers will recommend or promote the MCNC brand, product, or service.
What’s the difference between customer satisfaction and NPS? Why did we add it to our survey?
The main difference is that customer satisfaction scores typically measure short-term sentiment following a more recent interaction, while NPS focus on overall brand satisfaction and customer loyalty. NPS surveys asks clients to rate the likelihood of such on a scale of 0 to 10.
By answering one simple question, “How likely are you to refer or recommend [Insert Brand Here] to a colleague or peer?” Respondents will fall into one of three groups:
- Promoters (9-10): these are your main advocates – and great brand ambassadors willing to spread the word about you and your brand – in many channels including perhaps social media.
- Passives (7-8): these are customers that are indifferent, and are at risk of looking elsewhere for a similar service or product. You need to work harder to exceed the expectations of these customers, otherwise, they could easily switch to the competition.
- Detractors (0-6): these customers are unhappy with your brand and could potentially harm your reputation by sharing negative feedback.
Simply subtracting the percentage of Detractors from the percentage of Promoters will give you your NPS. And, in 2022, we’re pleased to have earned a NPS of 74! It should be noted that MCNC didn’t actually have 24 percent Detractors but those respondents didn’t answer the question. As such, we get the full benefit of learning from this first use of NPS and will designate the question as “required” when we send out next year’s survey.
But, we’re still pleased with the 74 and here’s why … Among the many benefits of NPS is the fact that you can measure your organization against those in your industry and other industries. Below is a snapshot of NPS Benchmarks for B2B by industry as conducted by Retently, an industry leader in net promoter scores.
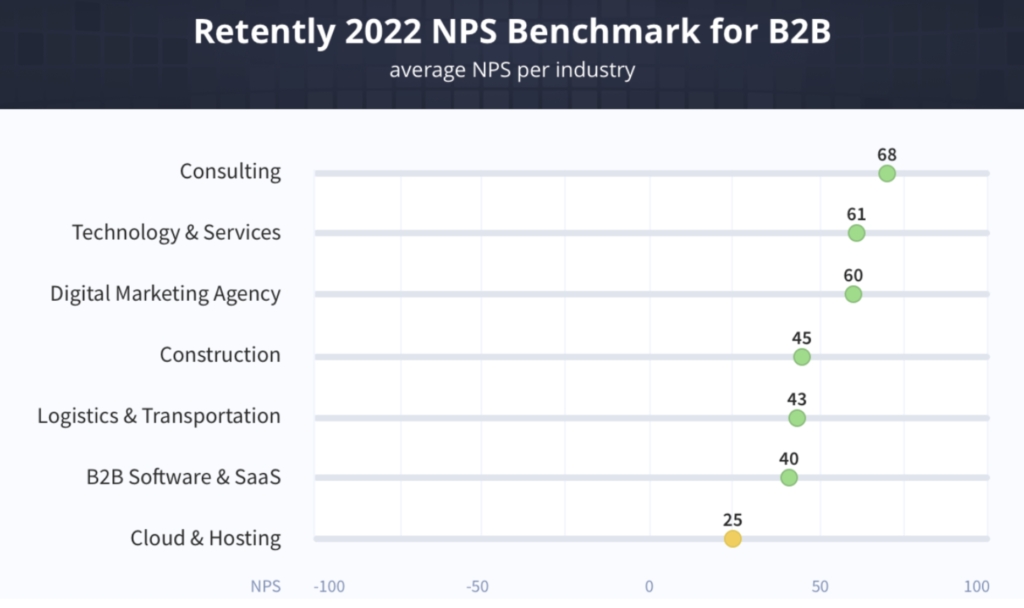
As you can see, our very fist measure of NPS, 74, puts MCNC above the industry benchmark for 2022. Thank you to our clients and the MCNC team for making this possible!
Return to the 12th annual 12 Days of Broadband >>>

